
We are ready to present you an extended tutorial on how to work with diagrams and graphs in Joomla 3.x. and transform Data into Information. Charts are a very good way to visualize a lot of data in a way that can be quickly digested.

Joomla Templates have several modules that could be used for adding diagrams and graphs to your site. Let’s take a closer look at these modules.
To add such module to your site, please, open the Extensions > Modules section in your admin panel.
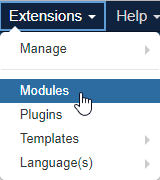
Click Add New button and search for TM Diagram and Graphs Flot Charts, TM Diagrams and Graphs D3Charts or TM Diagrams or Graphs Highcharts module.
All of these modules have common settings. We don’t want to repeat ourselves, so here is the list of common module settings:
- Item height — set the diagram or graph box height in pixels only;
- Item colors – choose a color for each diagram sector. The color must be specified in hexadecimal format (for example, #aabbcc). Also, it is possible to select a color from a palette provided.
- Item data –specify the data you want to show up in the diagram. Enter a numeric value into the Data field (example: 12,22,33,15,66). You can assign the name to each value. Note, the ratio in percentage terms between given values would be generated automatically.
- Item background – choose a diagram area background color. The color must be specified in hexadecimal format (for example, #aabbcc). Also, it is possible to select a color from a palette provided.
Besides those common settings, each module has its unique settings. Let discuss them further.
TM Diagrams and Graphs Flot charts
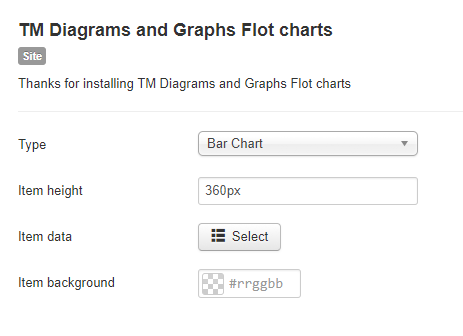
The 1st field you will notice in module settings is Type. Here you will see 8 variants of TM Diagram and Graphs Flot Charts module :
- Bar Chart.
- Spine Chart.
- Bar Chart.
- Spline Chart.
- Matrix Chart.
- Area Chart.
- Line Area Chart.
- Step Chart.
This module has the settings we described earlier. No custom settings are included, so you just have to select the type depending on your needs. TM Diagrams and Graphs Flot charts module displays diagrams and graphs without additional information added to them.
TM Diagrams and Graphs D3Charts
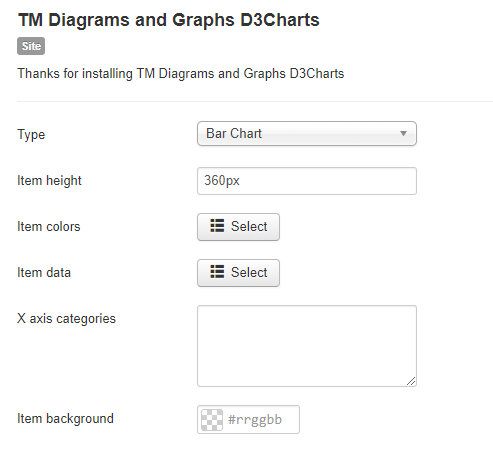
This module displays information with diagrams and graphs with the information added on hover. If that is what you need, navigate to the Extensions > Modules section in your Joomla backend. Search for “TM Diagrams and Graphs D3Charts” module and modify it.
Once you open this module you will see 6 variations under the type section:
- Bar Chart.
- Area Chart.
- Step Chart.
- Spline Chart.
- Sub Nav Char.
- MouseWheel Zoom Chart.
These module types have default settings mentioned earlier. Only 2 types have several additional settings:
MouseWheel Zoom Chart type includes X axis categories field, use it to gauge chart height.
X axis categories allow you to assign the name to each of chart categories. The default categories titles are 0, 1, 2, 3, 4, etc. Enter custom titles for categories without spaces and separated by commas. E.g., Jan,Feb,Mar,Apr,May,Jun,Jul,Aug,Sep,Oct,Nov,Dec.
TM Diagrams and Graphs Highcharts
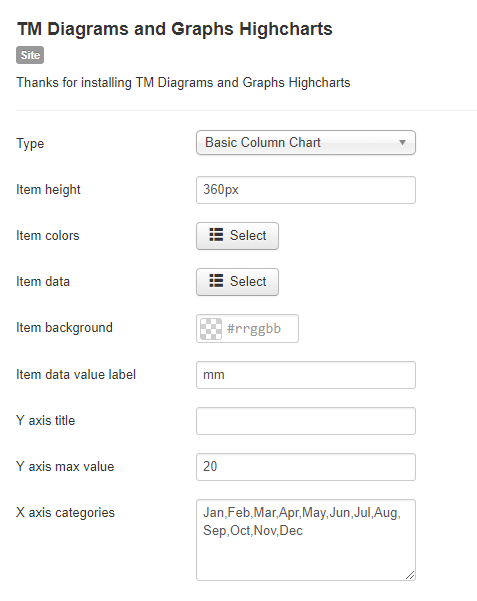
Open the same Extensions > Modules page in your admin panel and configure the ’TM Diagrams and Graphs Highcharts’ module.
You will see 5 different modules (5 variants of TM Diagram and Graphs Highcharts module) :
- Pie Chart
- Area Chart with Filter.
- Bar Chart with Filter.
- Column Chart with Filter.
- Basic Column Chart.
Besides the default aforementioned settings, this type has several additional ones:
Item data value label – enter the label for the measurement unit ($, %, km).
Y axis title – enter the title for the Y axis.
Y axis max value – enter the Y axis max value.
X axis categories we talked about earlier.
This module allows you to display diagrams and graphs with short information about content next to the actual chats.
That’s it! Feel free to select a module and its type you want. Now you know how to work with diagrams and graphs in Joomla 3.x templates. New instructions coming!